Using dashboards to improve productivity
Dashboards can deliver productivity data quickly and efficiently. But revenue cycle leaders considering their use should consider various pitfalls, including introducing productivity measurements to staff who may not be used to such public methods of communicating work performance. By considering such factors, revenue cycle directors and managers can lead successful dashboard implementations.
Considering organizational culture
Before introducing dashboards, consider staff experiences with productivity measurement in the past.“For example, imagine an organization where people were using only Excel and Access to monitor progress. Suddenly, they’re greeted with an interactive dashboard that highlights visual analytics. It can cause some consternation,” says Andy De, senior industry director, Healthcare and Life Sciences, Tableau.
To help manage such change, De recommends that managers create their dashboards to look more like the spreadsheets or documents that are familiar to staff. As they start using the new dashboards and any interactive capabilities, they will become more comfortable, which drives buy in and adoption.
Another area to consider is the history of transparency in a revenue cycle department, says De. Are people used to viewing data on departmental and individual performance and productivity? If not, what is the possible impact on the culture if the department embraces this transparency of efficiency and productivity?
“If organizations have no precedence for productivity management dashboards or scorecards, they can induce some fear and apprehension,” says De. “However, once the entire organization is embracing the notion of this paradigm of continuous performance improvement, it ceases to be less of a policing tool. The dashboard becomes an enabler of that continuous performance improvement paradigm, and it induces a spirit of healthy competition, predicated on the awards and recognition.”
Creating a center of excellence
Some large healthcare providers that are using dashboard software platforms develop a center of excellence that acts as a central organization to ensure adoption of new dashboards and platforms and to encourage best practices in design, development, and personalization, and using KPIs and metrics, says De. Typical centers of excellence may include the following elements.
Super users. A central pool of highly trained power users, or super users, can operate the center of excellence and help drive best practices from clinical staff to finance, operations, supply chain, and other departments. These super users are adept at not only creating dashboards, but also understanding how to personalize dashboards for C-suite leaders, managers, and staff.
Community. Users within the organization are encouraged to share their best practices through the center of excellence. “They organize events where a financial analyst compares created dashboards with a supply chain analyst versus a clinical analyst. They see who can work with the data and develop the most incisive and compelling dashboards that deliver the insights they need,” says De.
Communication. The center of excellence may also publish newsletters citing best practices and create portals where staff can share their best dashboards.
Considering other dashboard criteria
Other important decisions to make about developing dashboards include the following.
Enterprise data. Data may need to be aggregated from multiple data sources such as finance, revenue cycle management, and electronic health records. Questions to ask include, “Who will aggregate the data? How will that clean data become available via the dashboards to end users and consumers of the data?”
See related sidebar: Bridging the Gap Between Finance and Clinical Data
Audience size. What is the department and the size? How many people will be consuming the analytics and/or creating the analytics?
Custom solutions. The needs of CFOs are very different from the needs of staff analysts, or even finance managers. The CFO should have an aggregate view with red, green, and yellow lights for KPI alerts, capabilities that a staff analyst would not necessarily need.
“Understanding dashboard personalization for specific roles is a challenge that is not necessarily evident up front,” says De.
Dashboard goals. Decide whether a dashboard should track historical data from a rear‑view mirror perspective or if it should be forward‑looking and predictive to assist with risk management.
Using visual analytics
Advanced software programs that allow for customized dashboards can improve productivity for managers and analysts.
For example, Massachusetts General planned to harness improved analytics at the same time it was implementing a massive electronic health record (EHR) software upgrade. Across the board, the health system found that analysts were spending 90 percent of their time developing ad hoc dashboard-style reports, says De.
They set out to reduce time spent on ad hoc reports to 10 percent by implementing visual analytics. “At the end of the day, when the software was in place and working with their electronic health record, revenue cycle management systems, and clinical systems, they reduced that workload to less than 10 percent. Now, analysts could spend more time performing value‑added work rather than repetitive tasks,” says De.
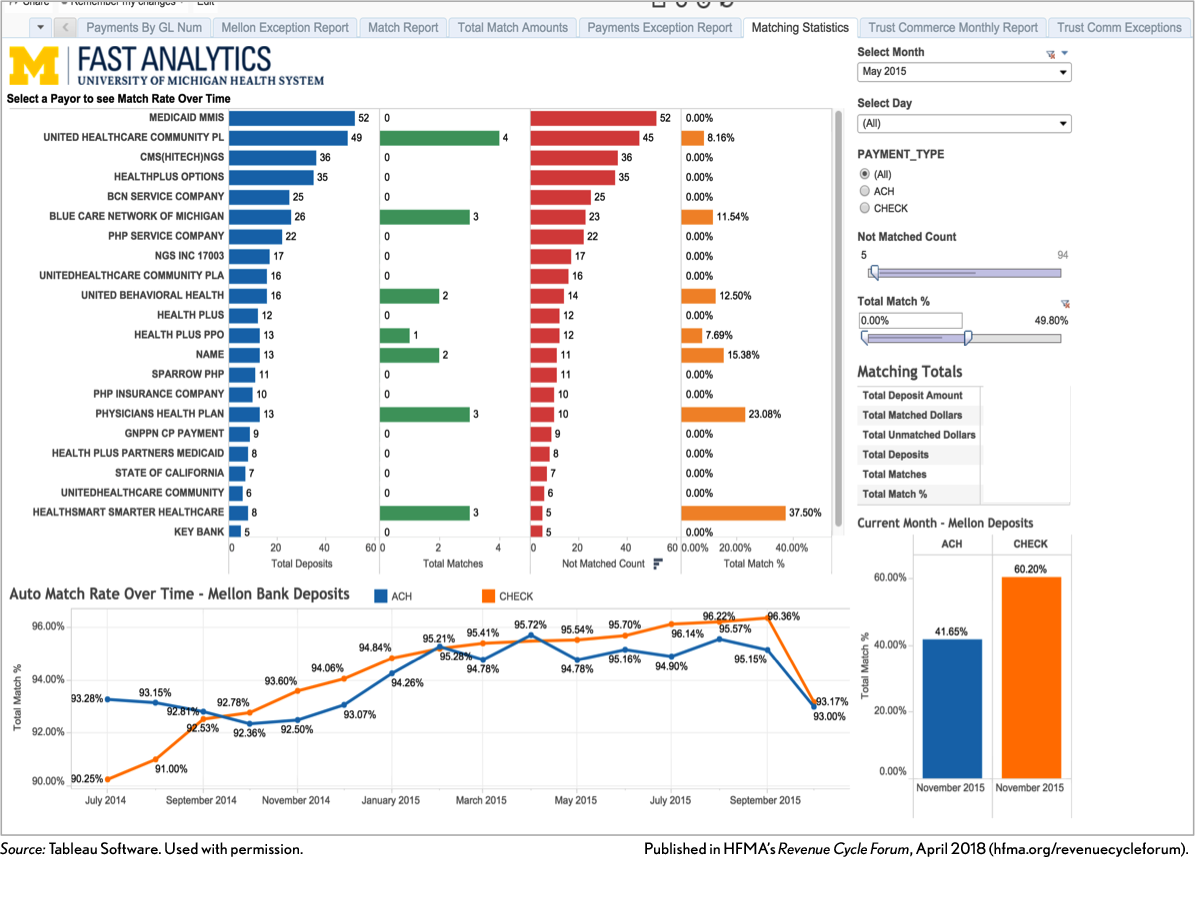
In a similar example from University of Michigan Health System, the goal was to eliminate repetitive monitoring and reporting tasks in the revenue cycle management arena and free analysts and clinicians to spend more time on value‑added work, rather than developing dashboards and reports.
University of Michigan Health System Payment Tracking

“The health system saved more than 10,000 hours of work by automating their finance and revenue cycle management processes and reports. It also helped them see patterns that they hadn’t seen before,” says De.
Managing dashboard implementation
By considering critical elements of dashboard implementation, revenue cycle leaders can successfully communicate departmental and individual progress while also discovering inefficiencies and improving productivity. Paying attention to culture, taking advantage of new technologies, and giving staff ways to share what they have learned can help hospitals and health systems meet quality requirements and lower costs.
Interviewed for this article:
Andy De is senior industry director, Healthcare and Life Sciences, Tableau.


