

In response to ongoing disruptions in the nursing workforce, exacerbated by COVID-19, health system finance and nursing leaders need to come together to find a new financial, clinical and operational approach to improving performance.
Being far from immune to the industry trends that have been fueling nursing shortages, UCLA Health in Los Angeles recognized the need to rethink its approach to workforce planning. The health system came to this realization as it faced its third surge from the pandemic in spring 2021.
UCLA Health’s journey
UCLA Health’s staffing metrics at that time showed both nurse turnover and vacancy rates were well below national averages, and although units were running over plan compared with volume, this pattern was not atypical for its units with high-acuity patients.
The weekly labor review process continued as normal, and replacement positions continued to be approved when supported by volume. But these actions did not appear to address the increase in complaints regarding staffing from nurses.
It was clear that neither finance nor nursing could address this issue alone without input from the other. The departments therefore formed a collaborative partnership to address the workforce challenges.
As a foundation for the partnership, finance and nursing analysts met weekly to identify challenges arising in the third pandemic surge that were not reflected in typical labor metrics, including the time it took to hire, onboard and train new staff and an increasing volume of staff departures. The analysts reported their findings in monthly meetings with executive leadership.
The analysts observed that the organization was relying on an increasing number of nurse float pools to bridge the resource gap. On average, 12% of staffing needs were filled by the float pools, with some units relying upward of 30% on the pools.
1 Connect the nursing, human resources and finance performance metrics. The goal of this effort was to understand the intersection of financial, clinical and operational variables to design a consensual solution that would address immediate needs and allow for long-term strategies to be implemented. (See the sidebar below, “Analytics for informing a workforce strategy,” at hfma.org/hfm for examples of metrics that a health system’s finance and nursing teams should review together as part of such an effort.)
To address immediate concerns, the two teams prioritized replacing float-pool resources with career staff assigned to specific units. As a result, 108 full-time employees (FTEs) were hired, providing more stable core staffing across all units.
The recommendation to hire these 108 career FTEs raised concern about the potential impact of such a move on the health system’s ability to flex staffing resources to volume and the potential overage in positions once RNs who were on leave returned to work. However, the teams established and agreed upon measures of success, including monitoring float pool usage, unit RN actual staffing versus productive flex position control and the actual RN hours per patient day (HPPD) compared with unit budget.
Upon addressing the immediate need, the solution designed by the nursing and finance teams was implemented across the organization. Additional metrics for monitoring reliance on noncore staffing were added to the weekly labor review, and the new organizational thinking, now known in the organization as “prospective hiring,” was expanded to other areas.
2 The finance and nursing teams reviewed actual RN and support staff HPPD for each unit against the budget, external benchmarks and historical trends. Their findings prompted them to update budgeted HPPD to align with the patient populations in each of the specialty and acute care units, and to reallocate total FTE budget accordingly.
UCLA Health’s effort demonstrated how the intersection of data can promote an agreed-upon understanding. The teams thus were able to work together to create a comprehensive plan, as outlined in the sidebar below, to stabilize the nursing workforce while maintaining safe, high-quality care in a quaternary health system.
UCLA workforce plan
Strategies to stabilize (Timeframe: three months – reassessed and extended in monthly increments as needed)
- Implement an extra shift differential for immediate workforce shortages. Of note, this is seen as a recognition by many nurses, which can fuel morale.
- Place orders with agencies and then focus attention inward on organizational resources that can be repurposed or supplement staffing needs.
- Protect the break relief program to reduce fatigue by ensuring nurses consistently get rest periods.
- Offer recruitment bonuses for staff referrals of experienced nurses.
- Seek to negotiate reasonable rates, while pursuing alternative solutions (e.g., just-in-time specialty orientations, new grad recruitment).
Strategies to thrive (Timeframe: one- to two-year plan)
- Use the operational data to determine provisional positions.
- Design a dynamic hiring, onboarding and orientation process to expedite bringing experienced nurses into the organization.
- Add additional educators, focusing on orientation to reduce the incidence of turnover.
- Reinstate and expand a new graduate RN hiring program, placing them in hard-to-fill specialties.
- Compensate preceptors in recognition of massive hiring efforts.
- Enhance retention efforts by continuing daily rounding, staff recognition and frequent communication.
- Restructure the daily management processes for real-time identification of issues and JIT frontline-driven interventions.
- Remember frontline nursing leaders to ensure they have the necessary support and resources.
- Design a trauma-informed care program to address stress and fatigue.
6 keys to CFO-CNO alignment around workforce strategy
In forging their new partnership, UCLA Health’s finance and nursing teams sought to define the key building blocks that were needed to ensure the success of their initiative. Together, they identified and described the following six prerequisites.
1 Common purpose. Craft an alliance that aligns a balanced vision of staffing levels, cost and investments necessary to reach culture, growth, financial performance and quality goals.
2 Common understanding. Be data- and evidence-driven in setting staffing ratios. Monitor trends in staffing levels, acuity and outcomes to inform forward decisions on care delivery. Pre-pandemic staffing levels may not be adequate for the new level of patient acuity.
3 Common determination. The CFO-CNO dyad should serve as experts and promote a plan to maintain a strong workforce that health system leadership can support.
4 Common commitment to consistency. Set and stay firm to patient care needs using acuity-based staffing, adhering to best practices to achieve quality outcomes. Avoid the temptation to expand bed capacity during periods of insufficient staffing. Refresh your surge plan, along with the strategic workforce plan to secure supplemental staffing when necessary.
5 Common culture. Create a model and environment that promotes meaningful problem-solving, communication and decision-making. Such a solution should includes intentional and structured joint rounding.
6 Common language. Formulate a communication plan structure to explain emerging trends to senior leadership and to enable aligned messaging to be easily delivered to leadership and staff.
A call to action for CFOs and CNOs
For any health system to succeed with such an undertaking, the CFO and the CNO must put the organization’s mission first. For UCLA Health, that mission is “to deliver leading-edge patient care, research, and education.” Collaboration and partnership help ensure finance and nursing can achieve exceptional outcomes while fostering and promoting financial sustainability. It also is important that such a partnership continues to evolve to match changes in care environment, staffing challenges and resource constraints.
The path to organizational healing will be marked by how well leaders strategize and innovate to improve workforce planning. This collaboration will require presence of mind for key stakeholders. It will require careful attention to the data, and discipline to preserve the right level of care while innovations and new technologies can be adopted to further ease demands placed on the organization’s workforce.
A renewed partnership between the CFO and the CNO is critical to achieving these results. Only together can they best understand the implications and opportunities revealed by robust data analytics and the impact on patient care.
How to use analytics to inform a workforce strategy and positive patient outcomes
The ability to apply lessons learned from the pandemic is a necessary part of developing an effective future workforce strategy. At a time when many health systems are expanding their risk in value-based partnerships with payers, balancing staffing with patient outcomes will be critical to health systems’ ability to maintain value and ensure their ongoing viability. As they collaborate in developing a strategy, finance and nursing leaders should consider key metrics that can help them understand factors contributing to changes in patient outcomes.
Following are some key industry metrics identified in recent study that evaluated staffing and patient data from both before and during the pandemic.a The analysis was segmented into four comparison groups based on hospital scale and complexity (with numbers of institutions shown in parentheses):
- Comprehensive academic medical centers (AMCs) (78)
- Large, specialized complex care medical centers (76)
- Complex care medical centers (98)
- Community hospitals (211)
CMI. Inpatient all-payer case mix index (CMI) increased across all comparison groups. The highest increase noted was 9% in the comprehensive AMC group, as shown in the exhibit below. This increase was driven by the rise in COVID-19 cases and increased patient comorbidities exacerbated by delayed care. Historical bed capacity of patients with a lower complexity per case appears to have been replaced by patients with a higher intensiveness per case, necessitating increased resource requirements to meet patient care demands.
Median average length of stay and case mix index prior to COVID-19 versus during COVID-19
| Compare group | Pre-COVID–19 Median | COVID-19 Median | Percentage change | |
| Average length of stay total | Comprehensive academic medical centers | 6.02 | 6.47 | 7% |
| Large, specialized complex care medical centers | 5.10 | 5.46 | 7% | |
| Complex care medical centers | 4.38 | 4.78 | 9% | |
| Community hospitals | 4.02 | 4.50 | 12% | |
| Case mix index (all patient) | Comprehensive academic medical centers | 2.00 | 2.18 | 9% |
| Large, specialized complex care medical centers | 1.70 | 1.76 | 4% | |
| Complex care medical centers | 1.57 | 1.67 | 6% | |
| Community hospitals | 1.40 | 1.42 | 2% |
Source: Vizient Operational Data Base (Q1 2017 – Q3 2021); n = 463 hospitals evaluated
ALOS. The CMI increase, compounded challenges of higher ICU and inpatient bed capacity demands and the lack of bed capacity in post-acute provider settings all contributed to a higher average length of stay (ALOS). ALOS increased across all compare groups, with the highest increase noted among community hospitals at 12%.
Labor issues. Increased nursing turnover and critical staffing shortages had a significant impact in increasing costs.b Compounding these challenges was the need to stabilize the remaining workforce by increasing base pay rates, overtime, shift differentials, premium or crisis pay and use of contract labor, as shown in the exhibit below. Increased ALOS and CMI also contributed to rising labor expenses. Although higher CMI likely increased net patient revenues through enhanced COVID-19 case payment, these increases may not have sufficiently covered additional operating expenses due to increases in ALOS and labor. This imbalance contributed to an overall decline of operating cash flow of 2% to 9% cited by ratings agencies.
Percentage change in key labor statstics, pre-COVID-19 to during COVID-19
| Compare group | Pre-COVID–19 Median | COVID-19 Median | Percentage change | |
| Overtime % | Comprehensive academic medical centers | 4.23 | 4.54 | 7% |
| Large, specialized complex care medical centers | 4.08 | 4.21 | 3% | |
| Complex care medical centers | 3.88 | 4.39 | 13% | |
| Community hospitals | 4.03 | 4.73 | 17% | |
| Contract hours paid as percentage of of total hours paid | Comprehensive academic medical centers | 1.02 | 1.45 | 42% |
| Large, specialized complex care medical centers | 2.15 | 3.16 | 47% | |
| Complex care medical centers | 0.97 | 2.86 | 196% | |
| Community hospitals | 1.56 | 2.55 | 63% | |
| Average hourly wage rate (area wage index adjusted) | Comprehensive academic medical centers | 36.53 | 40.98 | 12% |
| Large, specialized complex care medical centers | 36.13 | 41.83 | 16% | |
| Complex care medical centers | 37.72 | 42.00 | 11% | |
| Community hospitals | 37.94 | 41.43 | 9% | |
| Labor expense (area wage index adjusted) per CMI-weighted equivalent patient day | Comprehensive academic medical centers | $308 | $328 | 7% |
| Large, specialized complex care medical centers | $327 | $356 | 9% | |
| Complex care medical centers | $403 | $395 | -2% | |
| Community hospitals | $609 | $511 | -16% |
Source: Vizient Operational Data Base (Q1 2017 – Q3 2021); n = 463 hospitals evaluated
Staff productivity. Productivity of registered nurses (RN) and clinical staff — including licensed practical nurses (LPNs), licensed vocational nurses (LVNs) and technical support staff across three of the four compare groups — increased by 9% to 14%, as shown in the exhibit below. This apparent improvement was driven by staffing shortages and the inability to sustain historical staffing levels, however, which makes it of particular concern when considering the increased CMI and related patient intensity.
Percentage change in key hours works by nurses and other care providers, pre-COVID-19 to during COVID-19
| Compare group | Pre-COVID–19 Median | COVID-19 Median | Percentage change | |
| RN hours worked per CMI-weighted equivalent patient day | Comprehensive academic medical centers | 5.11 | 4.66 | -9% |
| Large, specialized complex care medical centers | 4.85 | 5.29 | 9% | |
| Complex care medical centers | 6.03 | 5.38 | -11% | |
| Community hospitals | 7.95 | 6.84 | -14% | |
| RN, LPN/LVN and other patient care provider (techs, clinical assistants) hours worked per CMI-weighted equivalent patient day | Comprehensive academic medical centers | 6.52 | 5.90 | -9% |
| Large, specialized complex care medical centers | 6.49 | 6.97 | 7% | |
| Complex care medical centers | 8.14 | 7.11 | -13% | |
| Community hospitals | 10.60 | 9.18 | -13% |
Source: Vizient Operational Data Base (Q1 2017 – Q3 2021); n = 463 hospitals evaluated
Given such improvements in nursing productivity, increased cost of labor and declining operating cash flow, should the finance-nursing team consider resetting nursing staff ratios going forward to reflect a new level of operating efficiency? Not so fast. The implications and consequences of this “improved” productivity trend are far from clear, and the nursing-finance team should be wary of making decisions based on incomplete dat
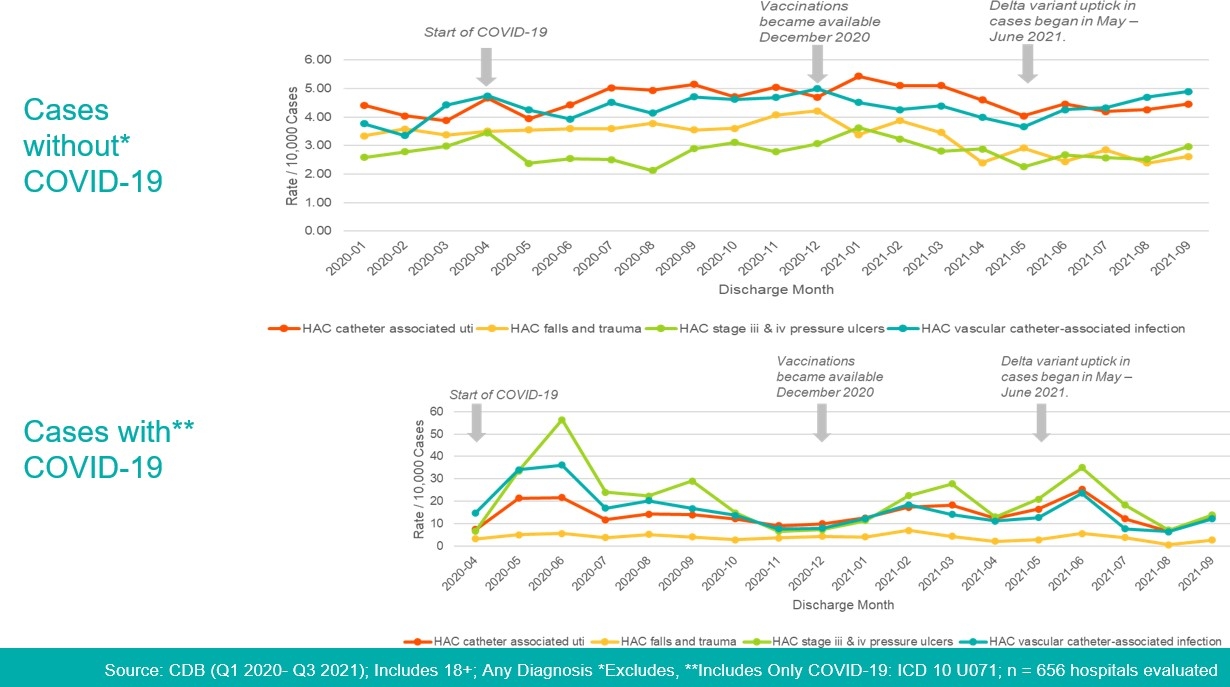
Researchers have raised concerns, for example, that COVID-19’s initial disruption of standard practice may have had a negative impact on patient outcomes, such as hospital-acquired conditions (HACs), making this issue an important one for the nursing-finance team to consider.c
A follow-up analysis to the one described previously found that each surge of the pandemic was met with an increase in the incidence of HACs among adult patients. This outcome may well have been a consequence of staff being over-burdened, apart from apparently showing improved productivity.
HAC performance, Q1 20220 – Q3 2021

Source: Vizient, January 2022
Simply put, the collaborative analysis should be robust enough to ensure the nursing-finance team has a sufficient range of data and context to promote well-informed decision-making.
Footnotes
a. The analysis, performed by Vizient, covered the pre-COVID-19 period from January 2017 through March 2020 and COVID-19 period from July 2020 through September 2021.
b. Hut, N. “The COVID-19-induced surge in healthcare labor costs is testing hospitals and health systems.” hfm, November 2021.
c. Grimley, K A., et al. “Nurse sensitive indicators and how COVID-19 influenced practice change,” Nurse Leader, May 2021.


