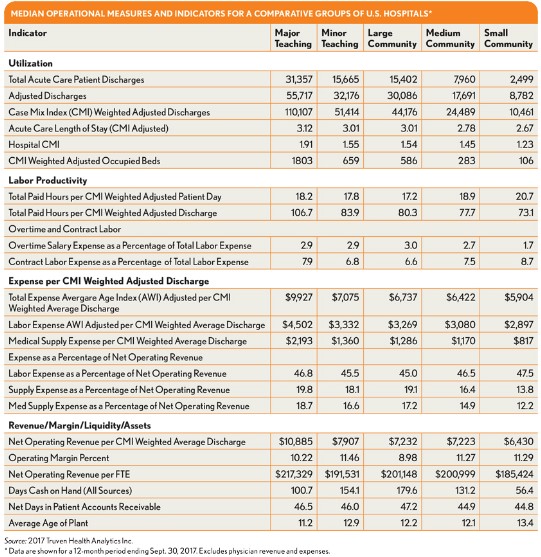
Median Indicators for 2017 Provide Snapshot of U.S. Hospitals’ Recent Operational Performance
Operational data collected from hospitals participating in a performance improvement program show trends among hospitals in five comparative groups. a Data for each comparative group were trimmed at an interquartile range of 1.5. The data were not adjusted to be representative of the nonfederal healthcare industry.
Perhaps the most notable indicator in this data set is average age of plant. This figure has increased in recent years from the historical level
of nine years to reflect a range of 11 to 13 years—a clear indication that many hospitals are deferring capital purchases and plant renovation.
Median Operational Measures and Indicators for a Comparative Groups of U.S. Hospitals

This research and analysis was prepared by Truven Health Analytics®, part of the IBM Watson Health business™. Data were collected from 599 hospitals participating in the ActionOI® operational performance improvement program. The comparative groups cited are based on definitions used in the Truven Health Analytics 100 Top Hospitals® program. For more information, please contact Phil Gaughan at [email protected], or Adam J. Wilbur at [email protected].
Footnotes
a. Comparative groups are based on definitions used in the Truven Health Analytics 100 Top Hospitals® program.


