How a Hospital or Health System Can Assess the Risk of Moving to Value-Based Payment
Health systems across the country are struggling to maintain their overall profitability and operating margins. Organization leaders realize they must take a hard look at their existing models to maintain their financial performance in the face of shifting payer mixes and stagnating payments as the industry moves from fee-for-service (FFS) to quality-based payment.
Adding to health system pressures is the country’s aging population. Every day about 10,000 Americans turn 65, meaning an ever-growing number of baby boomers are replacing their private insurance coverage with Medicare, which pays providers substantially less than commercial alternatives. a
In the face of these trends, health system leaders recognize it is imperative for them to update existing business practices to survive in a value-focused healthcare world. Health systems that have traditionally relied heavily on revenue from FFS hospital admissions want to understand the financial impact of specific changes, especially those designed to reduce inpatient utilization. Leaders also desire clarity about the most appropriate timing to move forward with diversification. In short, current health system leaders are asking, “Is the risk of maintaining our current business model lower than the risk of transitioning to value?”
Modeling Real-World Results to Find Answers
To answer the question and gain a clearer understanding of the financial impact of transitioning to value, healthcare executives can learn from the experiences of health systems that have undertaken similar migrations. Consider, for example, a model used by a large regional health system in California, which faced significant competition in a geographically defined market.b The model involved analyses of four reasonable scenarios aimed at:
- Providing an order-of-magnitude look at what happens to an organization that maintains the status quo
- Illustrating how a health system might manage the coming pressures by accelerating growth
- Examining the opportunity of transitioning some of the business to value-based arrangements and reducing inpatient utilization by shifting it to the outpatient setting
The model’s analyses used publicly available data from the California Office of Statewide Health and Planning Department and population projections by age cohort from the U.S. Census Bureau’s 2015 American Community Survey. The first step was to develop a seven-year financial pro forma to show how the projected growth would impact the system.
Two financial scenarios then were developed based on a 5 percent and a 10 percent decrease in inpatient utilization. The health system analyzed each scenario to see how discharges and financials were affected when the organization deployed value-based payment models.
The analyses included two key assumptions:
- Over the next seven years, the percentage of the population in Medicare will continue to grow as baby boomers increasingly enter their retirement years, while the percentage of the population covered by private insurance will decline.c
- The transition to value-focused care models, with their focus on preventive services, will lead to reduced unnecessary readmissions, lower inpatient utilization rates, and increased outpatient utilization.
Baseline Scenario
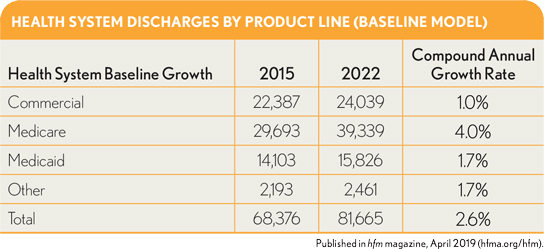
The analysis began with a look at how discharges were affected by the natural growth of different patient populations and a shifting payer mix. As shown in the exhibit below, the growth and aging of the population is expected to result in a significant increase in discharges, with Medicare patients representing about 73 percent of the incremental change.
As would be expected based on these projections, the health system can expect to realize a substantial increase in revenues, amounting to more than $300 million, as shown in the exhibit below. However, the shifting of the payer mix will degrade its operating margin by more than 3 percent and operating income by more than $42 million. Not all health systems would find such a shift devastating, but it could be so for organizations with less healthy operating margins, especially those located in slower growth markets. It should be noted that our case-study health system is starting with an enviable operating margin of more than 10 percent, but it does face challenges with some of the projected shifts in payer mix that could occur in the future.
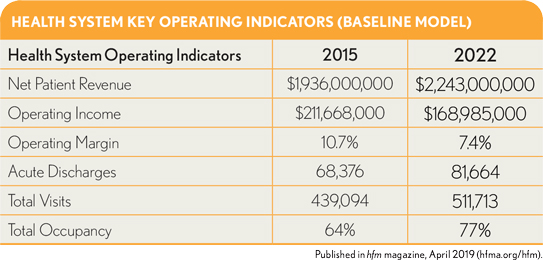
The significant increase in the occupancy rate also is noteworthy. Typically, health systems are full at about 75 percent of bed capacity, and occupancy rarely is spread evenly across campuses. This health system would likely need to expand capacity at one or more of its campuses to accommodate the additional volume.
Inpatient Utilization Reduction Scenario
Next, the impact on the health system of 5 percent and 10 percent drops in inpatient utilization was examined. Although the model accounted for potential increases in outpatient utilization (assuming 25 percent of the reduction in discharges shift to the ambulatory setting), the two scenarios did not point to a meaningful increase in value. A health system could experience such a scenario (i.e., with no meaningful increase in value) if any of the following were to occur:
- The health system’s traditional FFS payer contracts do not evolve on pace with the evolution of its care delivery model (e.g., it undertakes a shift to population health management but with limited or no value-based payment contracts).
- The payers in its market enforce hard utilization decreases through more stringent utilization management practices and retain all the value generated.
- An independent physician organization captures the value and does not share it with the health system.
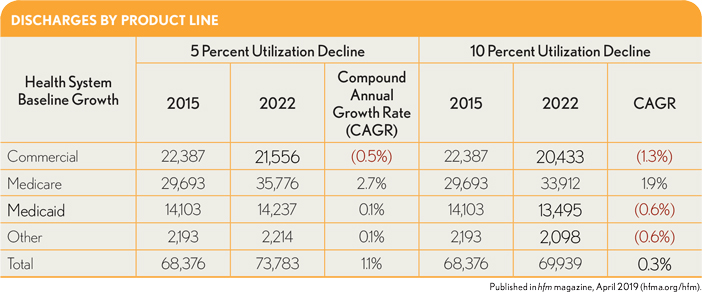
In this scenario, savings are being generated, but they all accrue to some combination of the payers and/or physicians, and not to the health system. The impacts on discharges and key operating indicators are shown in the two exhibits below. In the first of these exhibits, it is apparent the health system’s total discharges increase even as its utilization declines, predominantly because of the increase in Medicare discharges associated with the overall population growth and aging of this market. The difference between this scenario and the baseline scenario is the health system has capacity for this limited volume growth and should be able to accommodate it in its current inpatient chassis.
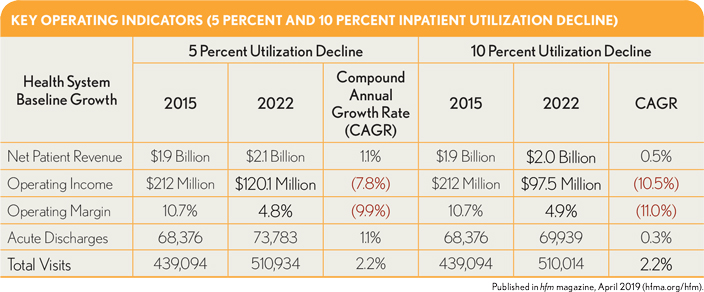
.The second exhibit above, shows that, even with the decreases in utilization, revenue increases because overall volume grows. However, this growth is not profitable for the health system because a significant amount is in Medicare, which is a negative-margin business for this organization.
The model also shows dramatic decreases in operating revenues compared with the 2015 baseline: by $91.9 million and $114.5 million, respectively, under the two utilization-decline scenarios. In both cases, operating margins decrease by more than half over the seven years. Interestingly, the operating margin changes are similar, regardless of whether utilization declines by 5 percent or 10 percent. This effect occurs because the outpatient-to-inpatient volume ratio is higher when utilization declines by 10 percent and the outpatient business maintains a favorable margin. Finally, by 2022, inpatient margins are nearly flat because of the shifts in payer mix.
Market-Share-Shift Scenario
The third scenario was focused on calculating the volume growth and associated market share shifts that would be required to maintain operating margins at the 2015 rate of 10.7 percent, assuming inpatient utilization were to decline either 5 percent or 10 percent. The analysis (not shown here) disclosed that by 2022, the health system would need to increase market share incrementally by 7 percent if utilization were to decline 5 percent, and by 9 percent if utilization were to fall 10 percent. However, gaining additional market share is not an easy task, especially in competitive urban markets, and it requires investment in growth strategies, strong execution, and brand enhancement.
From a practical standpoint, such market share growth over a seven-year period would likely be elusive, requiring a massive investment in growth at the expense of profitability. The constraints of this health system’s current inpatient bed capacity would not accommodate such high growth without significant expansion. A reasonable conclusion is the health system would be unable to maintain its historical operating margins if its market share were to expand equally across product lines.
Value-Model Scenario
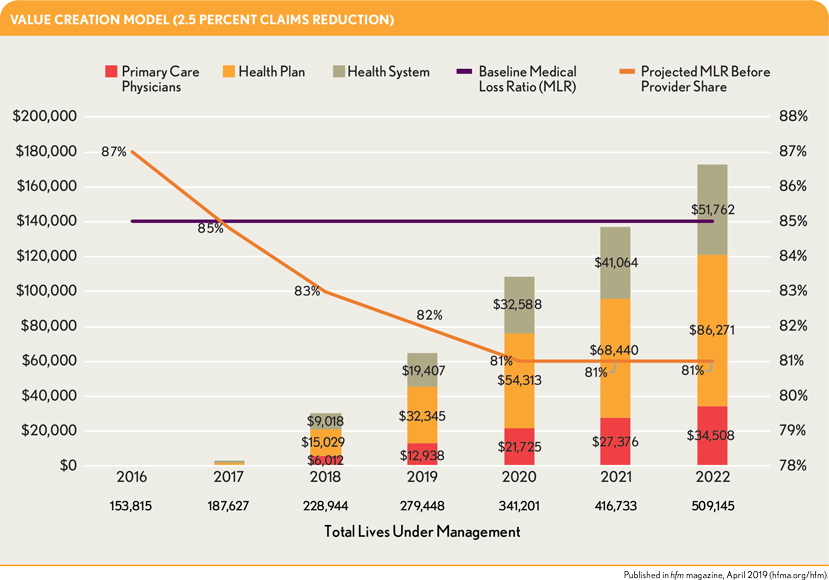
The final scenario, depicted in the exhibits below, considered how value creation would offset declines in inpatient utilization amounting to 5 percent and 10 percent. The model assumes the health system and its physician network have transitioned to value-based payment and established contracts with insurers in 2017 that share accrued value as follows:
- 50 percent to the health plan
- 30 percent to the health system
- 20 percent to the primary care physicians
Additional assumptions included the following:
- Investments in value-based infrastructure (e.g., operational services to enable provider engagement, care management programs, population health technology, and value-based contracting) occurred in 2015, and the models were implemented in 2016.
- The health system’s Medicare and commercial lives under management are expected to increase from 15 percent in 2016 to plateau at 50 percent in 2020.
- Medicaid starts at 10 percent under management and ramps up to 25 percent in 2020 and plateaus. (Note that this health system is largely in geographic localities having more favorable payer mixes, and the neonatal intensive care unit (NICU) is responsible for a high percentage of its Medicaid volume.)
- For the 5 percent and 10 percent utilization decreases, there were corresponding decreases in claims reduction that would amount to half those rates by 2022 (i.e., 2.5 percent and 5 percent, respectively).
- An 85 percent medical loss ratio (MLR) threshold was applied for the providers to begin generating value across their value-based payment contracts.
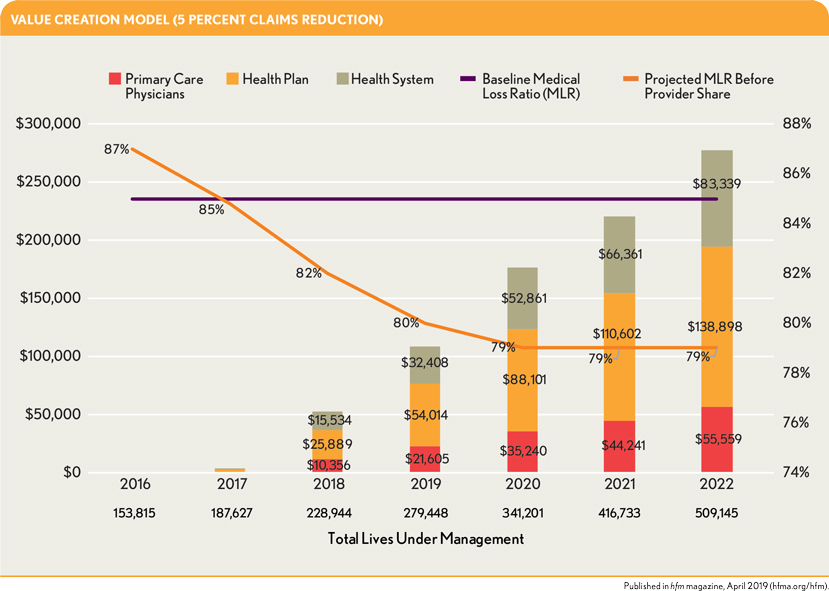
The exhibits above show the health system generates little or no value in the early years, but generates increasing value in later years. This pattern aligns with the widely accepted premise that providers require at least two to three years working in a structured model to begin achieving favorable outcomes.
Implications of the Analyses
Analyses across these four scenarios point to the following conclusions.
Moving to value is less risky than maintaining the status quo. Health systems weighing the financial risks of moving to value versus maintaining the status quo will discover that making the transition now is the safer alternative. In the scenarios described here, inpatient utilization fell 5 percent and 10 percent relative to the baseline scenario as value-based care practices were implemented, but population growth fueled an increase in health system revenues. The aging of the population, however, led to shifts in the payer mix from private insurance to Medicare. Because of Medicare’s lower payment rates, the health system experienced a decline in operating income.
These analyses also show overall population growth can lessen the financial impact of a decline in inpatient utilization.
The financial challenges will be greater in slower-growth regions. In areas of the country experiencing little or no population growth, such as the Rust Belt, the expansion of privately insured populations will be slower, although Medicare populations will continue to expand. As health systems implement value-based payment models and work to reduce utilization, their pool of patients covered by commercial insurance may not be large enough to offset financial losses from their growing Medicare population.
Cost-cutting measures help but are not enough. Health systems leaders may seek to trim costs to adjust for changing market conditions and the aging of patient populations, but these measures will be insufficient to ensure long-term financial health. Cutting expenses will help, especially in high-cost environments, but organizations also must make foundational changes to shift care away from the four walls of the hospital, grow the ambulatory side of their business, and implement value-based care initiatives to improve the overall health of their patient populations.
Additional bed capacity is not required. Organizations that successfully transition to value won’t need to worry about increasing their capacity. Given that most health systems will not require all their excess bed capacity under any value-focused scenario, leaders could reduce certain fixed costs by shuttering units or hospitals or eliminating select services.
The time to act is now. The model described here examined the financial health of the California health system over a seven-year time horizon. This health system started with a strong balance sheet, favorable payer mix, and strong market growth, yet over time, its financial health looked increasingly bleak. These analyses underscore the need for financially healthy organizations to begin the transition to value now—while they can afford it.
These analyses are primarily applicable to larger health systems and the model could look very different for a smaller system. Smaller systems should evaluate their scenario even more closely to understand potential impacts. For example, rural hospitals or health systems with $300 million or less in net patient revenue should evaluate the transition to value more carefully, especially as it relates to their network, primary care panel density, and ability to control costs/utilization. These organizations will likely need to partner with larger organizations because they may not be able to generate the value-based revenue required to cover the cost of standing up to the population health infrastructure.
Further, it should be noted the model as described here assumes the case study health system’s expenses would remain the same over the model’s time frame to simplify this discussion and to allow for a focus on specific dynamic impacts. That said, with the growth the health system is projected to experience over the time horizon, cost reductions will not come easily. It should be emphasized, therefore, that knowing where Medicare margins are today and how they are predicted to change over time, hospitals will need to focus on cost reductions in the future.
Changing market conditions will lead to declining margins for all health systems that choose to accept the status quo for another few years. To preserve their financial health, organizations should begin investing now in value-based care infrastructures and models. Health systems also should view the transition over an extended time horizon and not expect to recoup their investment in the first year or two.
Even financially healthy organizations cannot escape the impact of changing demographics and evolving market conditions that threaten their long-term viability. Although the transition to value involves risk, a well-defined strategy can lessen those risks and pave the way for enduring success.
Footnotes
a. Pelech, D., An Analysis of Private-Sector Prices for Physicians’ Services , Working Paper 2018-1, Working Paper Series, Congressional Budget Office, January 2018.
b. The focus here is on a California health system because of the California market’s broad public availability of data. The intent is not to focus on the California market, but rather on the principles of how moving to value affects health system financials in ways that are relevant in other markets as well. As more systems across the country begin to make this transformation, the increasing ability to access more publicly available data will further contribute a better understanding of the overall strategic and financial impacts of such a shift.
c. Although the intent here us to show the differences in payer mix, the discussion is mainly focused on the importance of Medicare margins and the increasing Medicare population.


